| |
Sophisticated Loan Repayment Forecasting
 Occasionally Ive worked for finance companies to created models that projected cash flows from a portfolio of loans over time. Now most companies, and indeed most individuals have dealt with standard amortization tables. Youve seen them: payments are constant, and initially youre paying almost all interest and somehow, magically, at the end of 30 years the last payment is almost entirely principal to finish the repayment. Naturally, its not too hard to do this in Excel, where four lines suffice to show the outstanding principal, principal payments, interest payments, and total payments. Conveniently, Excel even has built-in functions for these (PPMT, IPMT, and PMT). Occasionally Ive worked for finance companies to created models that projected cash flows from a portfolio of loans over time. Now most companies, and indeed most individuals have dealt with standard amortization tables. Youve seen them: payments are constant, and initially youre paying almost all interest and somehow, magically, at the end of 30 years the last payment is almost entirely principal to finish the repayment. Naturally, its not too hard to do this in Excel, where four lines suffice to show the outstanding principal, principal payments, interest payments, and total payments. Conveniently, Excel even has built-in functions for these (PPMT, IPMT, and PMT).
Finance company models add a layer of sophistication because, basically, one of three things happens:
- You make your payment
- You default on the loan (in reality this has a few stages to it where maybe you miss a payment and later catch up, but those are minor effects compared to a full default).
- You prepay the loan, e.g. if you sell the house or refinance the loan.
 Lenders understand these analytics and keep statistics on how likely default or prepayment is at any time in the loans life. While the financial modeling on this can get a bit tricky, its not too hard to show what cash is likely to flow from a group of similar loans made at the same time.
While these scenarios increase complexity, weve really only gotten started. Finance companies, of course, dont just make one loan or a bunch of loans one time, but they originate loans every month. Fast forward three years and you have a portfolio of loans where some are in Month 1 and some are in Month 36 and everything in between. This added timing component is what most models struggle with. Lenders understand these analytics and keep statistics on how likely default or prepayment is at any time in the loans life. While the financial modeling on this can get a bit tricky, its not too hard to show what cash is likely to flow from a group of similar loans made at the same time.
While these scenarios increase complexity, weve really only gotten started. Finance companies, of course, dont just make one loan or a bunch of loans one time, but they originate loans every month. Fast forward three years and you have a portfolio of loans where some are in Month 1 and some are in Month 36 and everything in between. This added timing component is what most models struggle with.
Most models handle this piece through two main methods:
- Repeat the analysis either in additional rows or additional sheets. For example, one relatively simple model I saw took 64 rows to complete the basic cash flow analysis. These 64 rows were repeated ten times so that the five-year model assumed originations happened either in June or December of each year. Other times Ive seen over one hundred different worksheets to handle different origination periods. The problem Ive had with this method is mainly in its difficulty to maintain. If you want to add one extra row of calcs and the row sets are repeated vertically,
 you need to add the row and code in 10 different places, and its both time consuming to do so and easy to make a mistake. If you used different sheets, that might work if youre careful enough to select all sheets when modifying, but its easy to have a model expand to an unwieldy number of sheets (like hundreds of them) if you start adding many originating periods and different loan types. you need to add the row and code in 10 different places, and its both time consuming to do so and easy to make a mistake. If you used different sheets, that might work if youre careful enough to select all sheets when modifying, but its easy to have a model expand to an unwieldy number of sheets (like hundreds of them) if you start adding many originating periods and different loan types.
 Go to VBA code. You can program the amortization, default, and prepayment calculations in VBA. Then, when you want to run the model, it calcs in VBA and writes results to the spreadsheet. If youre comfortable in VBA, this can be a powerful alternative. On the other hand, it becomes less of a real-time tool, since any change to assumptions requires you to run a multi-minute macro. This greatly reduces the benefit of living in the Excel environment. Go to VBA code. You can program the amortization, default, and prepayment calculations in VBA. Then, when you want to run the model, it calcs in VBA and writes results to the spreadsheet. If youre comfortable in VBA, this can be a powerful alternative. On the other hand, it becomes less of a real-time tool, since any change to assumptions requires you to run a multi-minute macro. This greatly reduces the benefit of living in the Excel environment.
And this brings me to the heart of this newsletter. Isnt there a better way, one which both allows new wrinkles to be added while still running in real time? Yes, there is. The key is my favorite Excel function: SUMPRODUCT. Essentially, the key is to figure out how one generic $1,000 loan will behave and then scale that over time. The example below shows the essence of the solution. I find this an incredibly powerful method in modeling and Im curious to hear if others have found different elegant solutions. 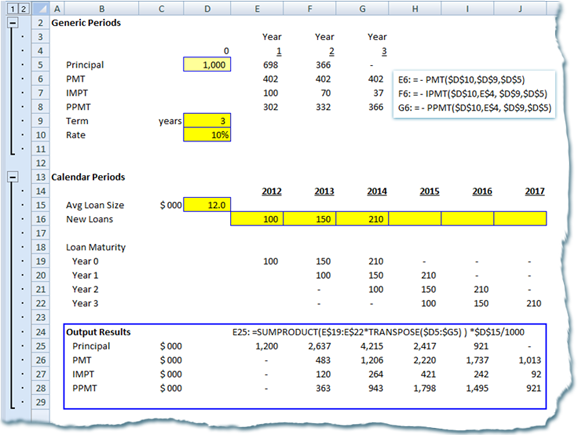
|
|