| |
Beware Changing Valuation Methodologies!
- Academics agree on NPV.
My first exposure to corporate finance was learning valuation methodologies at Marakon Associates. Whereas so much of modeling and forecasting is inherently unknowable, complex, and imprecise, once you get down to a series of cash flows the academics agree that discounted cash flow is the way to get a single value, the NPV, that represents the value of that stream. So it’s a red flag when I see real-world business practitioners spending millions of dollars using methodologies at odds with these best practices.
- The oil and gas industry presents a classic application for valuing future cash flows.
Recently I was working with a client in the oil and gas industry. (This is not a new industry for me: as far back as 1990 I was working on a legal case where Texaco, Exxon, Union, Mobile, and Shell faced off against the State of California and the Federal government over, among other things, the value of improperly developing an oil field.) This industry is interesting in that geological and technological inputs determine an output of production over many years. The price is set by large markets and can be easily found, so production x price = revenue. Production costs are borne by the operator, and the land owner receives a royalty based on revenue. Thus with a price forecast we know the stream of cash flows and can easily value them. Typically the industry uses the current price and discounts cash flows at 8%.
- The industry changes valuation methods in a low-price environment.
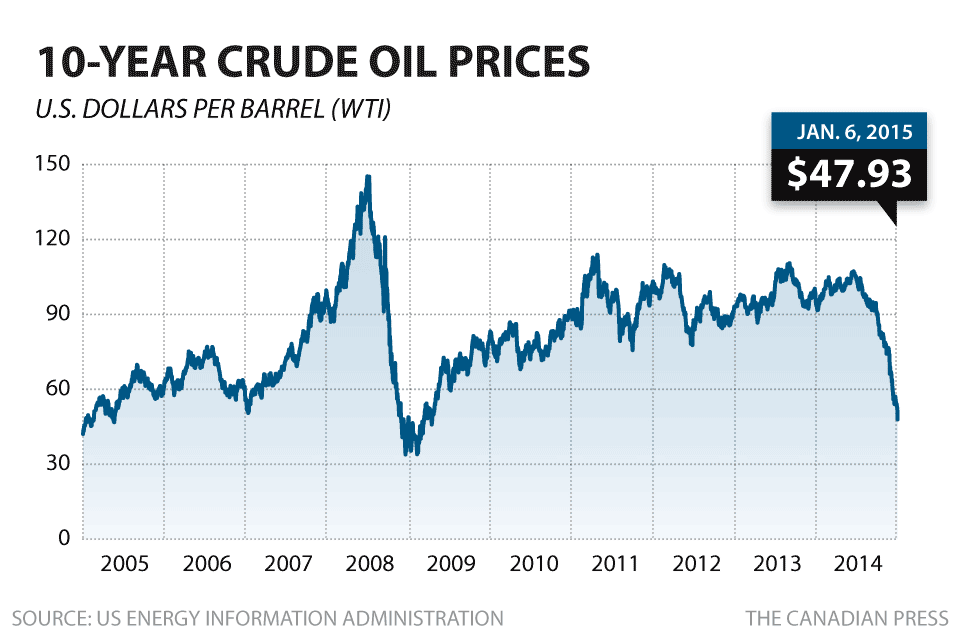
Today, prices have fallen to new lows, and naturally that decreases valuations. The problem is that the sellers were unwilling to sell at the prices kicked out by the discounted cash flow model. Clearly they had a different perception of value. So how does an aggressive buyer justify paying higher prices? What I observed was that they changed valuation methodologies.
This is where it gets fun. Apparently the industry has conventions about how to value these cash flow streams. One is called “PV10”, which Investopedia defines as:
“PV10 is the present value of estimated future oil and gas revenues, net of
estimated direct expenses, discounted at an annual discount rate of 10%. “
Similarly, when they were discounting cash flows at 8%, that’s called PV8. So the way they justified the higher prices was to move to PV2--discounting cash flows at 2%.
-
Changing valuation methods hides a price forecast assumption.
I started getting suspicious when I realized that even with the valuation change, the investors were focused on IRR metrics because IRR is independent of any discount rate. The definition of IRR is the discount rate that makes NPV = 0.
When I looked at my client’s analysis of the deals I noticed that the PV2 values were all 44% higher than the PV8 deals. Later I noticed scenarios where they increased commodity prices, and I saw that a 20% higher price resulted in a 20% higher valuation. This makes sense, since revenue = production x price, and production is the same in each case.
Wait a second... if a change in price moves NPV by a fixed percentage and a change in valuation methodology changes NPV by a fixed percentage doesn’t that imply that the change in methodology can be reduced to an equivalent change in price?
Yes, it does. The exact percentage depends on the underlying production decline rate, but as I roughed out a production stream that mimicked the NPVs I became increasingly confident in this insight.
- In fact, we can show the price change by any move from PV8 to a different PVx:
PV8 Conversion Table
| Discount Rate |
Implied Price Increase |
| 2% |
44% |
| 4% |
26% |
| 6% |
12% |
| 8% |
0% |
| 10% |
-10% |
The caveat I’d give here is that these are not hard and fast mathematical rules that always apply. Instead these are applicable to the data (i.e. the production stream implied by how value moved as price moves), as described above.
- Buyers and sellers had different price forecasts
At the heart of my objection is that my Marakon training says that arbitrarily changing discount rates is intellectually dishonest. There is really only one rate that is RIGHT and we should make decisions based on that. The discount rate, for review, is best described as the CAPM rate: Kf + Beta * MRP. So if the correct rate for a cost of capital is 8%, then so be it.
The real disconnect between buyers and sellers is not that they were thinking of different valuation methodologies, but rather that they had different price forecasts. When the buyers were assuming today’s price would prevail over the next ten years, sellers were implicitly thinking that the historically low prices would not remain low, but increase by nearly 50% on average.
- Oil prices are, understandably, hard to predict
- Now we can explain how IRRs change as both expected and realized prices change.
Essentially we can look at two variables:
1) How much to increase the purchase price to get deals done (i.e. the expected price level), and
2) How will commodity prices really differ from now, on average, for the deal
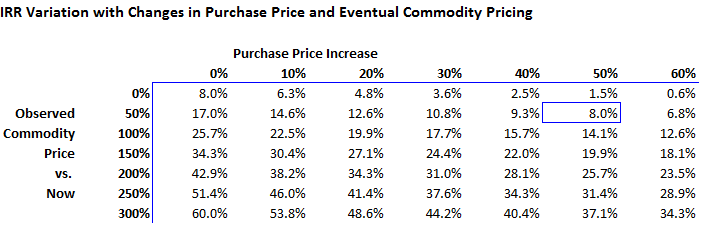
These are shown in the table below. The “Purchase Price Increase” is shown by the columns and the “Observed Commodity Price” is on the rows, shown as how much higher it is than today’s price.
Note the one highlighted cell, at 50% purchase price increase and 50% commodity price increase. That has an 8% IRR, because the NPV was originally calculated with an 8% discount rate, and increasing all numbers by 50% still gives us an 8% IRR.
- We can avoid valuation pitfalls by using these explicit price forecasts
So what? Well, instead of justifying paying larger price increases by changing the valuation methodology, now we have a different way to proceed. If PV8 is the acceptable methodology in good times, it also has to be used in bad times. But we can explicitly understand our assumptions: that if we plan to pay a 40% premium for properties, we’re essentially betting that average commodity prices will be 40% higher to keep the same 8% IRR. If commodity prices are higher, then IRR goes up. And the table above quantifies those movements.
In the end, what I really care about is whether you get a bad signal from a weird valuation scheme. For example, some companies will make an investment only if it has a payback of under two years. Consider a deal where you give me $1 and in 25 months I give you $100, all completely guaranteed. The company with a two-year payback requirement rejects the deal--one they should accept. And that’s the problem with metrics besides NPV: you have false positives (you do deals you should avoid) and false negatives (you avoid deals you should do). With PV2 instead of PV8, if it increases valuations by 44% and you think prices will only recover by 30% over the long term, then you’re overpaying. And that’s the danger of hiding your true assumptions behind a change in valuation methodology.

|
|
|