
|
The Brode Report | June 2010
|
||||||||

|
A 25-Point Financial Model Scorecard - How does your financial model measure up? When we begin working with a new client they typically share their current financial model and want to get our view on its strengths and weaknesses. We developed a standardized evaluation methodology in response: the Financial Model Scorecard. We have previously published bits & pieces of this scorecard, but we now have the most up-to-date version with over 8 years of application in the field. The scorecard evaluates models based on the four messages the model must convey to investors when seeking capital. These four messages are:
The 25-Point Financial Model Scorecard I. High Financial IQ (9 points)
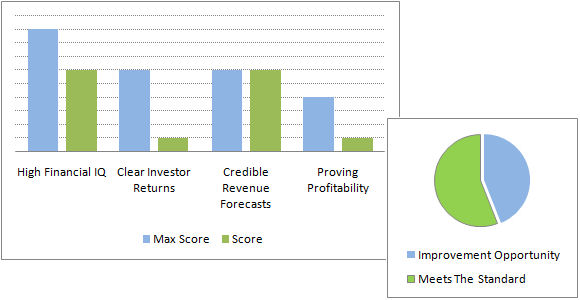
It's been eye-opening to use a standardized approach: models that at first look pretty solid wind up scoring 36 out of 100. Of course, this doesn't mean that the model is bad. Instead it points to *where* work needs to be done to get the model to a point where numbers are not a roadblock to doing a deal. Every model doesn't need each of the items. Some items are for internal use only and have information that typically isn't released until later in the process, i.e. certain cap table details. Where Do Most Models Fall Down? The worst fail the High Financial IQ test entirely. We've all seen of models like this, where it's just so awful that you can't even evaluate the business. Further, its clear that the work is not fundable in its current form. The next major dividing line is between models which are static as opposed to dynamic. The most basic static models present one basic scenario, with most of the revenue and expense numbers hardcoded. Hey, it's a start, but it doesn't let investors understand the true economic dynamics of the business model. In some businesses, 10% decrease in revenue would cause a 7% of revenue decrease in expenses. In others it would cause a 1% decrease. These dynamics are what's measured in the Proving Profitability section, and this is the section that takes a real modeler to build. Finally, companies regularly overestimate revenue and underestimate sales & marketing expenses. The crucial interplay between marketing, price, and volume is easy to miss in the early stages of a company. So how do you stack up?
|
||||||
| |
Connect with me | | | Share your thoughts | | | Subscribe | | | See past issues | | | www.brodegroup.com |
| New York: +1 212.203.6974 | London: +44 020 8123.8053 | Vail: +1 303.444.3300 |