Who Won The Olympics?
You might think it was the US, with the most golds and medal points, followed by China, Russia, and the UK. The top ten nations are shown here:
| Olympic Medals |
3 |
2 |
1 |
Total |
Points |
 |
| Gold |
Silver |
Bronze |
| 1 |
United States |
46 |
29 |
29 |
104 |
225 |
| 2 |
China |
38 |
27 |
23 |
99 |
191 |
| 3 |
Russia |
24 |
26 |
32 |
82 |
156 |
| 4 |
United Kingdom |
29 |
17 |
19 |
65 |
140 |
| 5 |
Germany |
11 |
19 |
14 |
44 |
85 |
 |
| 6 |
France |
11 |
11 |
12 |
34 |
67 |
| 7 |
Japan |
7 |
14 |
17 |
38 |
66 |
| 8 |
Australia |
7 |
16 |
12 |
35 |
65 |
| 9 |
South Korea |
13 |
8 |
7 |
28 |
62 |
| 10 |
Italy |
8 |
9 |
11 |
28 |
53 |
| |
While I like seeing the US come out on top, it does strike me as a bit of an unfair analysis. Is it really fair to compare Australia (pop. 22M) to China (pop. 1.3B)? It sure seems right to adjust for population. Also, we all know that funding matters, so it seems like average wealth should be a factor. Conveniently, Population x GDP per Capita = GDP, and its pretty easy to find data on GDP for countries to match up against the Olympic results.
On that basis, I looked at the Top 20 economies, which account for 85% of world GDP. Ranking is by Points per Trillion Dollars of GDP. On this basis Russia and the UK move up, while China and the US fall back. In fact, the US falls to twelfth place, nearly 1/6th as efficient as Russia at getting medals.
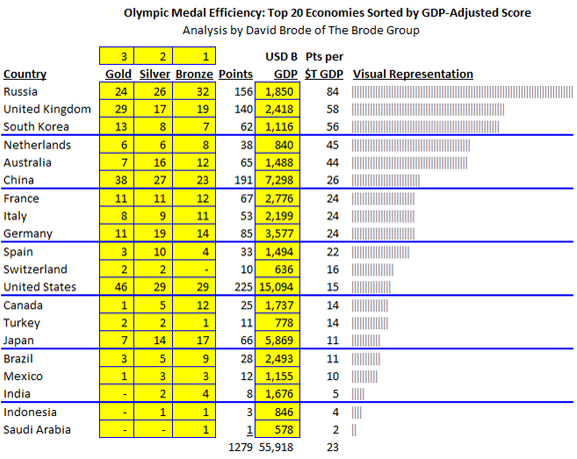
It gets even worse for the US: the expected score among all nations is 28 points per trillion dollars of GDP, and the US is nearly half that.
On the other hand, the real standouts are as follows. Grenada and Montenegro are flukes, very small countries that won a single medal. But you have to admire the results of Jamaica (all 200M or shorter), Kenya (distance running), Belarus, and Cuba (wide-ranging, but lots of boxing and judo).
| Olympic Medals |
3 |
2 |
1 |
Total |
Points |
Match
GDP |
GDP
($M) |
GDP
$T |
Pts/$T
GDP |
| Gold |
Silver |
Bronze |
| 1 |
Grenada |
1 |
- |
- |
1 |
3 |
67 |
822 |
0.0 |
3,649.64 |
| 2 |
Jamaica |
4 |
4 |
4 |
12 |
24 |
84 |
14,807 |
0.0 |
1,620.86 |
| 3 |
Georgia |
1 |
3 |
3 |
7 |
12 |
63 |
14,347 |
0.0 |
836.41 |
| 4 |
Mongolia |
- |
2 |
3 |
5 |
7 |
112 |
8,506 |
0.0 |
822.95 |
| 5 |
Kenya |
2 |
4 |
5 |
11 |
19 |
88 |
34,796 |
0.0 |
546.04 |
| 6 |
North Korea |
4 |
- |
2 |
6 |
14 |
123 |
28,000 |
0.0 |
500.00 |
| 7 |
Ethiopia |
3 |
1 |
3 |
7 |
14 |
57 |
31,256 |
0.0 |
447.91 |
| 8 |
Montenegro |
- |
1 |
- |
1 |
2 |
113 |
4,536 |
0.0 |
440.92 |
| 9 |
Belarus |
3 |
5 |
5 |
13 |
24 |
15 |
55,483 |
0.1 |
432.56 |
| 10 |
Cuba |
5 |
3 |
6 |
14 |
27 |
44 |
62,705 |
0.1 |
430.59 |
|
|
|
|
|
|
|
|
|
|
|
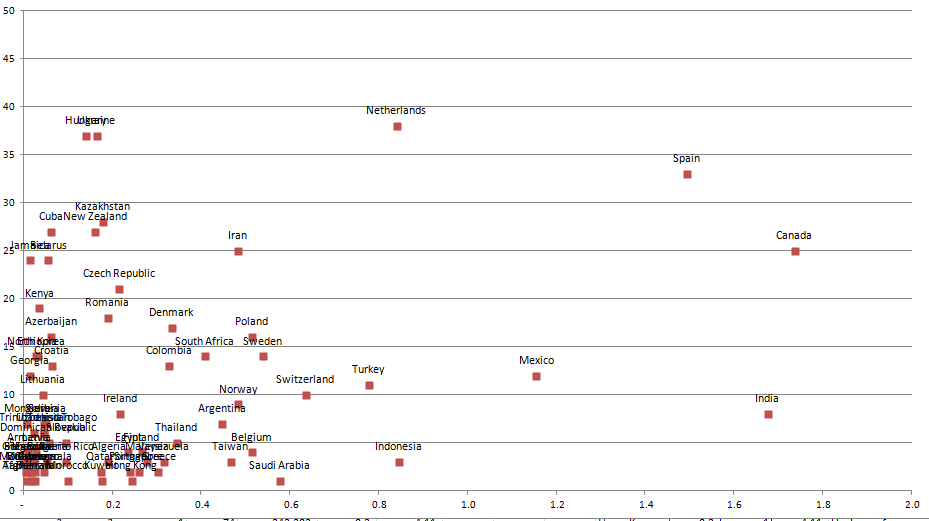
For you data junkies out there, here are many of the nations plotted out. Its best to be in the upper left quadrant. Y-axis is medals; X-axis is GDP. Poland is right on the expected medals line, so, for example, Romania and Iran outperformed whereas Mexico and India underperformed.
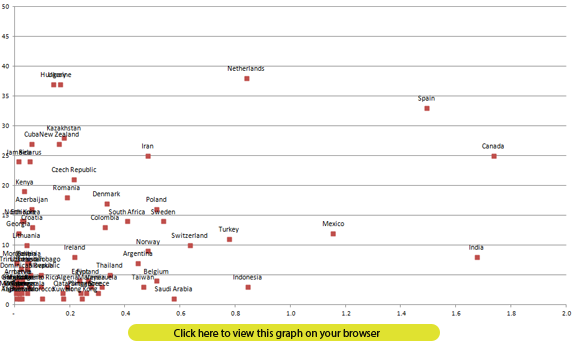
The New York Times has their own chart of this, which they have unadjusted and adjusted for population for 2008 and 2012. Click on the chart below to view it on your browser:

This Economist did a also considered population and GDP per capital in his analysis. Click on the chart below to view this analysis:


|